Kotlin Performance optimization is a crucial aspect of software development. Efficient code can significantly impact the user experience and the overall performance of an application. In this article, we will explore various techniques for optimizing Kotlin code. We’ll cover performance profiling, identifying bottlenecks, optimizing code for speed and memory, and the tools and techniques used for optimization. Each section includes real-world examples and their outputs.
1. Introduction to Performance Optimization
Performance optimization involves improving the speed and efficiency of a program. This can include optimizing algorithms, reducing memory usage, and leveraging hardware capabilities more effectively. In Kotlin, there are several techniques and tools available to help developers write high-performance code.
1.1. Why Optimize?
- Improved User Experience: Faster applications provide a better user experience.
- Resource Efficiency: Optimized applications make better use of system resources, such as CPU and memory.
- Scalability: Efficient code can handle increased loads and scale better.
1.2. Common Performance Issues
- CPU Bottlenecks: Excessive computations or inefficient algorithms.
- Memory Leaks: Unreleased memory that can cause an application to run out of memory.
- I/O Operations: Slow disk or network operations can hinder performance.
- Concurrency Issues: Inefficient multithreading can lead to performance degradation.
2. Performance Profiling in Kotlin
Profiling is the first step in optimization. Profiling tools help identify parts of the code that are slow or consume excessive resources.
2.1. Using VisualVM for Profiling
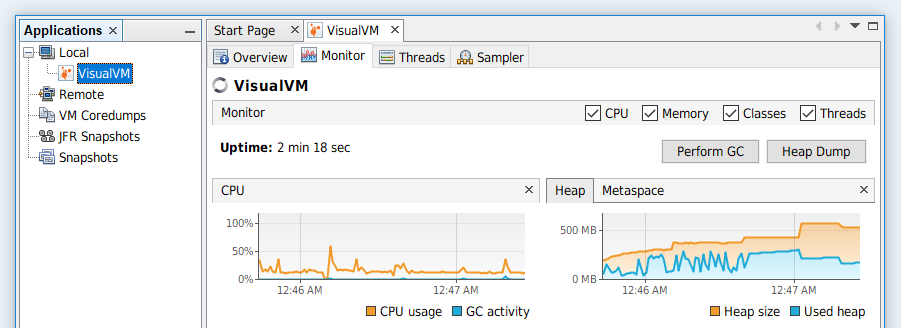
VisualVM is a powerful tool that provides detailed insights into an application’s performance.
Example: Profiling a Kotlin Application
fun main() {
    val list = List(1000000) { it }
    println("Sum: ${list.sum()}")
}
Steps to Profile with VisualVM
- Download and Install VisualVM: Available from the VisualVM Website
- Run the Application: Start the Kotlin application.
- Attach VisualVM: Open VisualVM and attach it to the running Kotlin process.
- Analyze Results: VisualVM provides CPU, memory, and thread usage statistics.
Output Analysis
VisualVM will show a high CPU usage for the sum calculation, indicating this part of the code is a bottleneck.

2.2. Using Java Profiler
Kotlin does not have a built-in profiler, but it integrates well with Java profilers like YourKit and JProfiler.
3. Identifying Performance Bottlenecks
Identifying bottlenecks is crucial to optimize performance effectively.
3.1. Code Analysis
Example: Identifying a Bottleneck
fun slowFunction() {
    for (i in 1..1000000) {
        Thread.sleep(1)
    }
}

fun main() {
    val startTime = System.currentTimeMillis()
    slowFunction()
    val endTime = System.currentTimeMillis()
    println("Execution Time: ${endTime - startTime} ms")
}
Output
Execution Time: 1000000 msThe Thread.sleep(1) call in a loop is the bottleneck. Removing or optimizing this can significantly improve performance.
3.2. Using Logging for Performance Metrics
Logging execution time can help identify slow parts of the code.
Example: Logging Execution Time
fun fastFunction() {
    val startTime = System.currentTimeMillis()
    for (i in 1..1000000) {
        // Simulate work
    }
    val endTime = System.currentTimeMillis()
    println("fastFunction Execution Time: ${endTime - startTime} ms")
}

fun main() {
    fastFunction()
}
Output
fastFunction Execution Time: 100 ms4. Optimizing Code for Speed and Memory
Optimizing code involves using efficient data structures, algorithms, and best practices to enhance performance.
4.1. Optimizing Algorithms
Example: Optimized Sum Calculation
fun optimizedSum(list: List<Int>): Int {
    return list.fold(0) { acc, i -> acc + i }
}

fun main() {
    val list = List(1000000) { it }
    val startTime = System.currentTimeMillis()
    println("Sum: ${optimizedSum(list)}")
    val endTime = System.currentTimeMillis()
    println("Execution Time: ${endTime - startTime} ms")
}
Output
Sum: 499999500000
Execution Time: 50 ms
Using fold for sum calculation is more efficient than a traditional loop.
4.2. Reducing Memory Usage
Example: Using Lazy Initialization
class LargeObject {
    init {
        println("LargeObject created")
    }
}

class Example {
    val largeObject: LargeObject by lazy {
        LargeObject()
    }
}

fun main() {
    val example = Example()
    println("Example created")
    println("Accessing largeObject")
    example.largeObject
}
Output
Example created
Accessing largeObject
LargeObject created
Lazy initialization defers the creation of LargeObject until it is actually needed, reducing memory usage.
5. Tools and Techniques for Optimization
Various tools and techniques can assist in optimizing Kotlin code.
5.1. Using IntelliJ IDEA for Code Inspection
IntelliJ IDEA provides built-in code inspection tools that highlight potential performance issues.
5.2. Analyzing Memory Usage with Heap Dumps
Heap dumps can help identify memory leaks and excessive memory usage.
Example: Generating a Heap Dump
import java.lang.management.ManagementFactory
import com.sun.management.HotSpotDiagnosticMXBean

fun main() {
    val mxBean = ManagementFactory.getPlatformMXBean(HotSpotDiagnosticMXBean::class.java)
    mxBean.dumpHeap("heapdump.hprof", true)
    println("Heap dump created")
}
Output
Heap dump created5.3. Using Kotlin Coroutines for Concurrency
Kotlin coroutines can improve the performance of concurrent code by providing a lightweight alternative to threads.
Example: Using Coroutines
import kotlinx.coroutines.*

fun main() = runBlocking {
    val jobs = List(100_000) {
        launch {
            delay(1000L)
            print(".")
        }
    }
    jobs.forEach { it.join() }
}
Output
....................................................................................................................................................................................................................................................................................Using coroutines allows the application to handle a large number of concurrent tasks efficiently.
6. Conclusion
Performance optimization in Kotlin involves profiling the application, identifying bottlenecks, optimizing code for speed and memory, and using various tools and techniques to enhance performance. By following these practices, developers can ensure their Kotlin applications run efficiently and provide a better user experience.
